
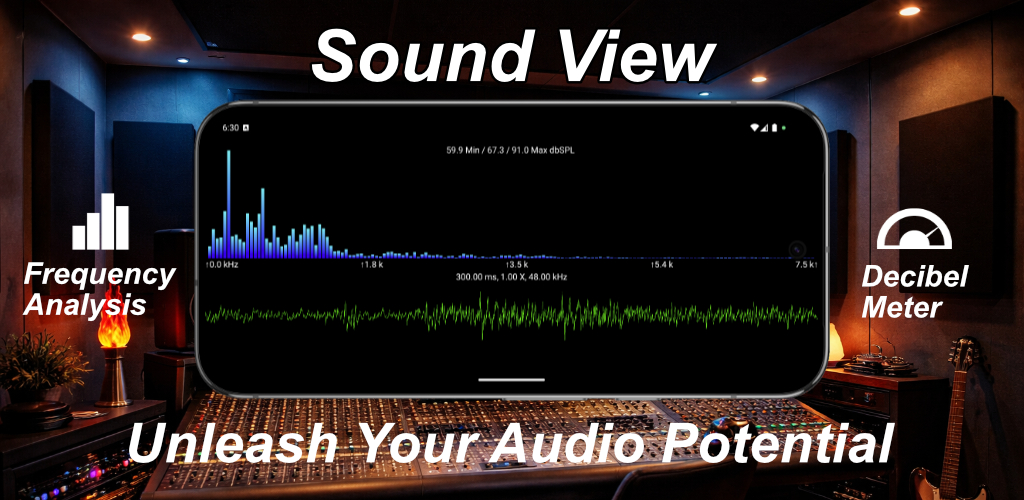


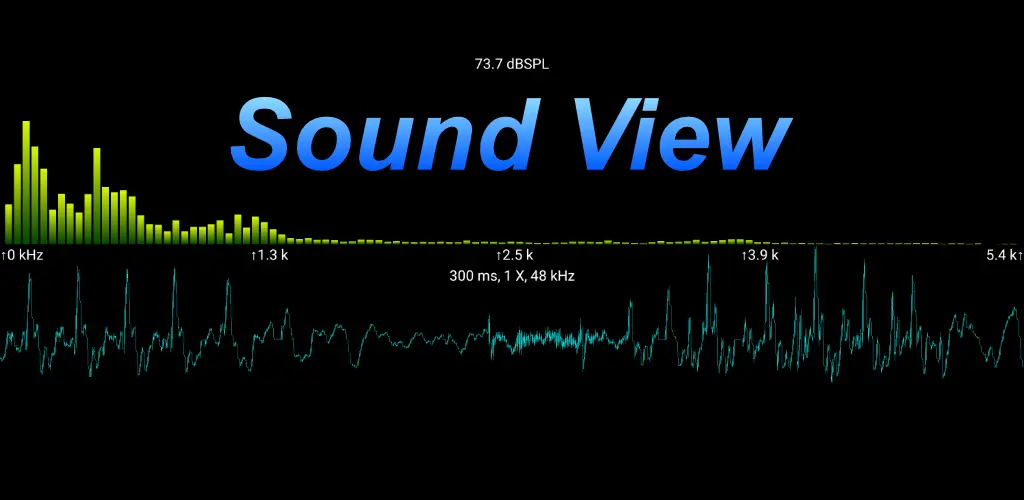
Sound You Can See !
Sound View is a high-performance Audio Spectrum Analyzer that turns your device into a professional-grade acoustic tool. Whether you are a sound engineer, a music student, or a hobbyist interested in acoustics, Sound View allows you to visualize and analyze sound captured from your built-in or external microphone.
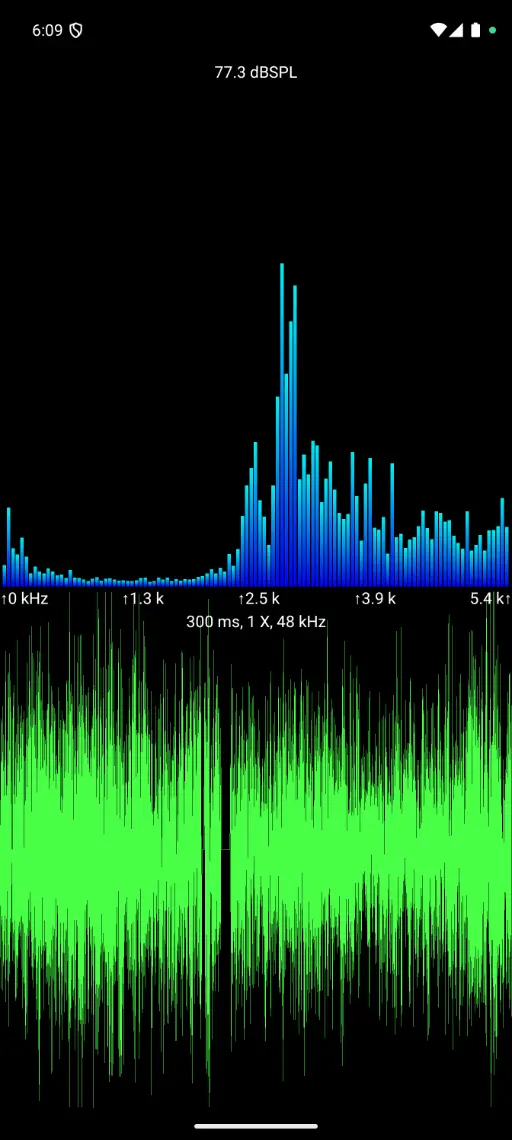
Real-Time Visual Analysis
High-Resolution Performance
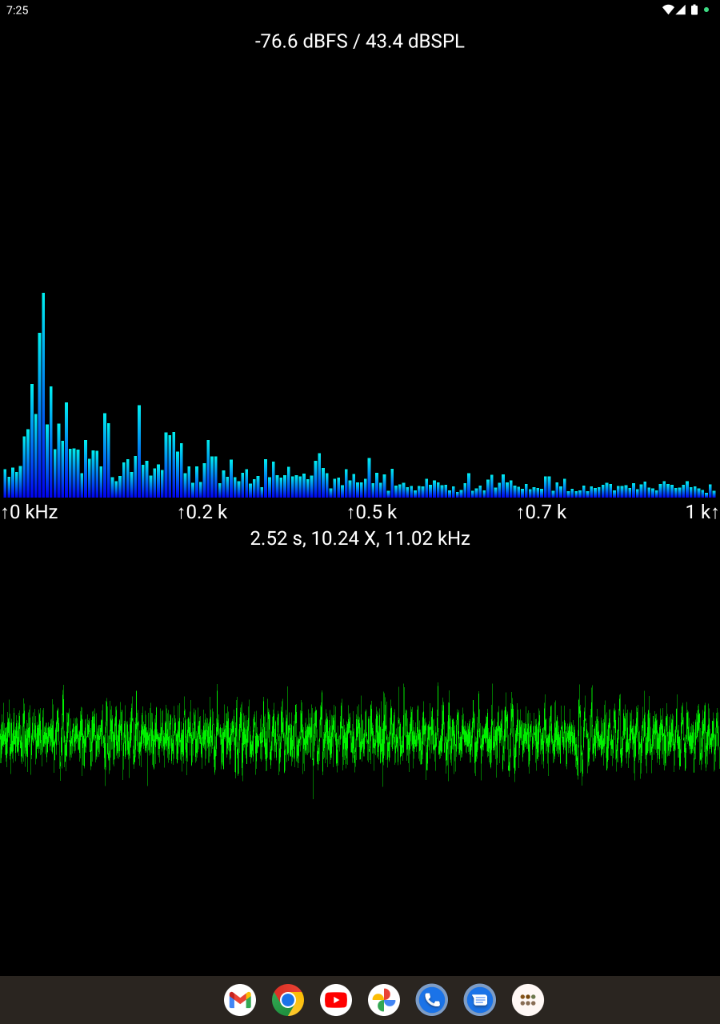
Unlock the full potential of your hardware. Sound View supports frequency ranges from 0Hz up to 96kHz (depending on device capabilities). With sample rates doubling your frequency range (e.g., 48,000 samples/sec for 24,000Hz analysis), you get precision data that goes well beyond the limits of human hearing.
Deep-Dive Navigation
Full-Screen Focus: Double-tap either the spectrum or the waveform to expand it to full-screen mode.
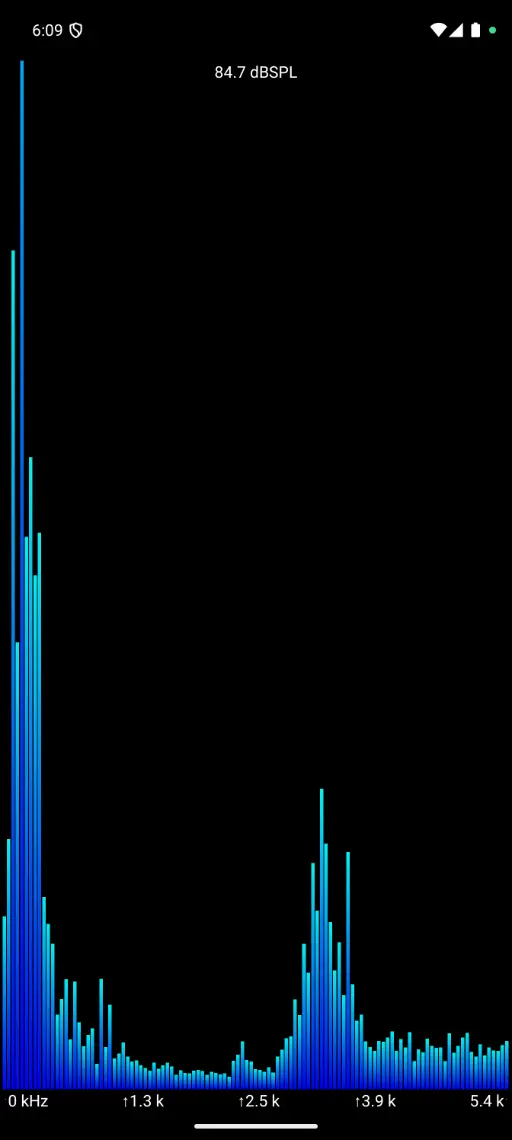
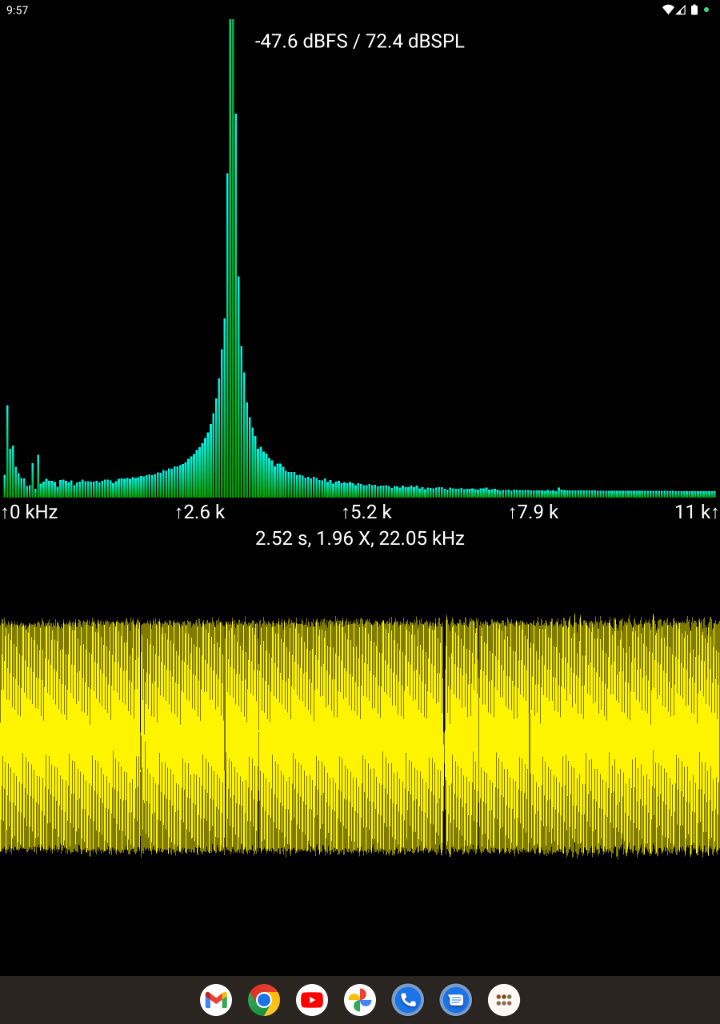
Professional Decibel Meter
Track signal strength with the integrated dBSPL (Sound Pressure Level) meter. The app tracks and displays your minimum and maximum decibel levels—perfect for monitoring ambient noise or calibrating equipment. Reset your peaks at any time with a single tap.
Key Features:
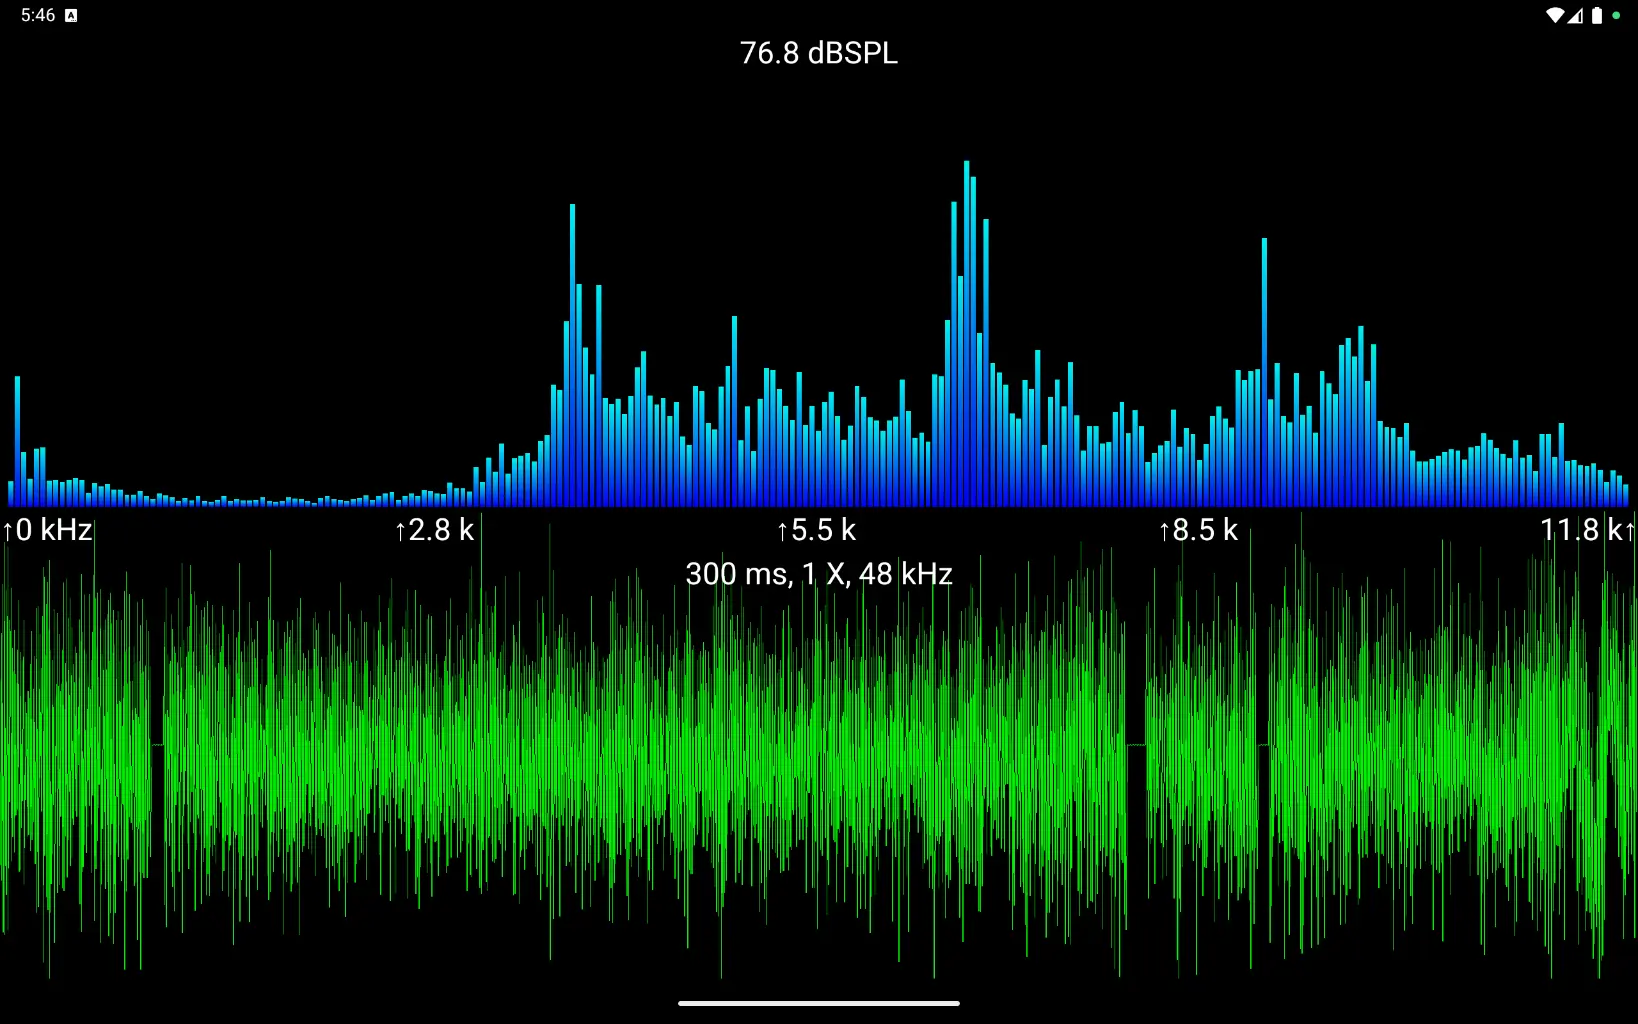
Tablet Landscape Views
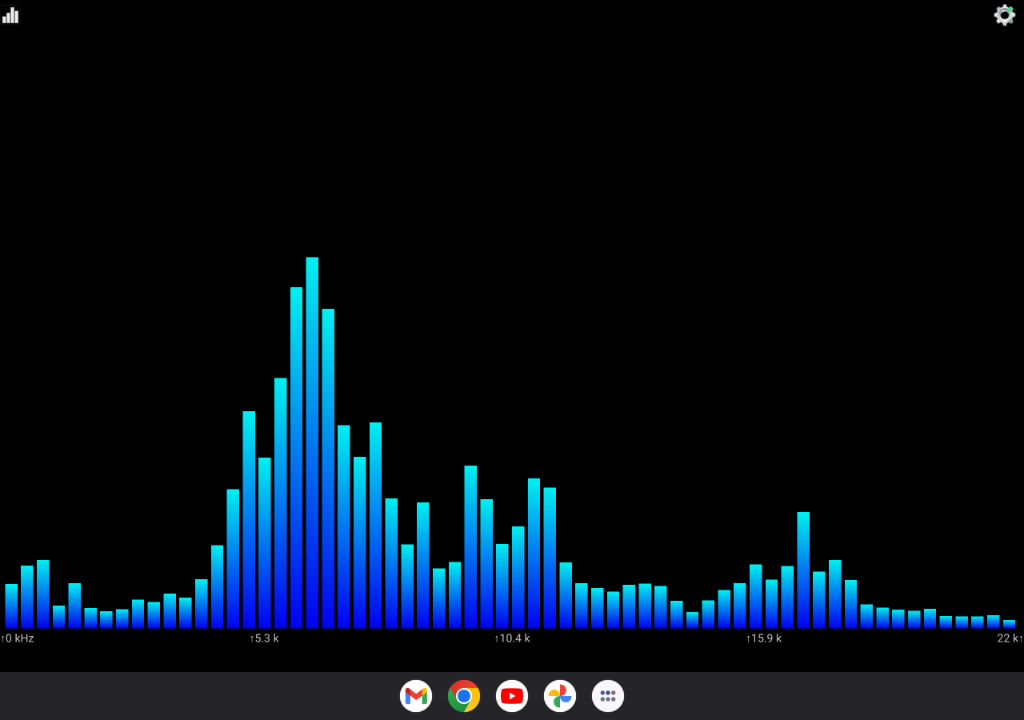
Full Screen Spectrum
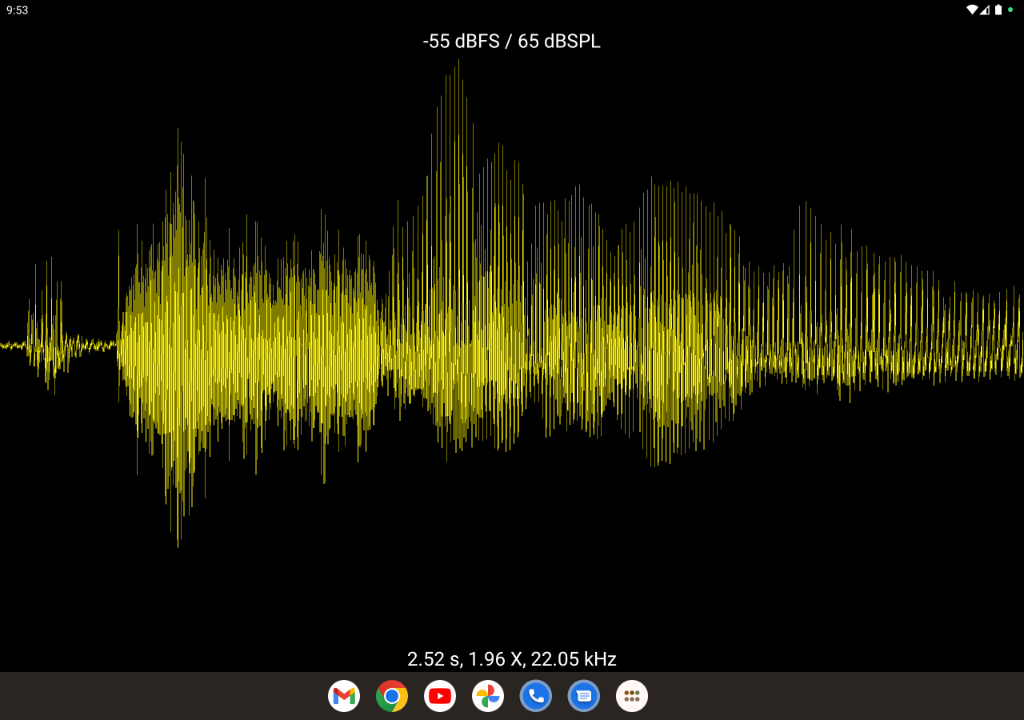
Full Screen Waveform
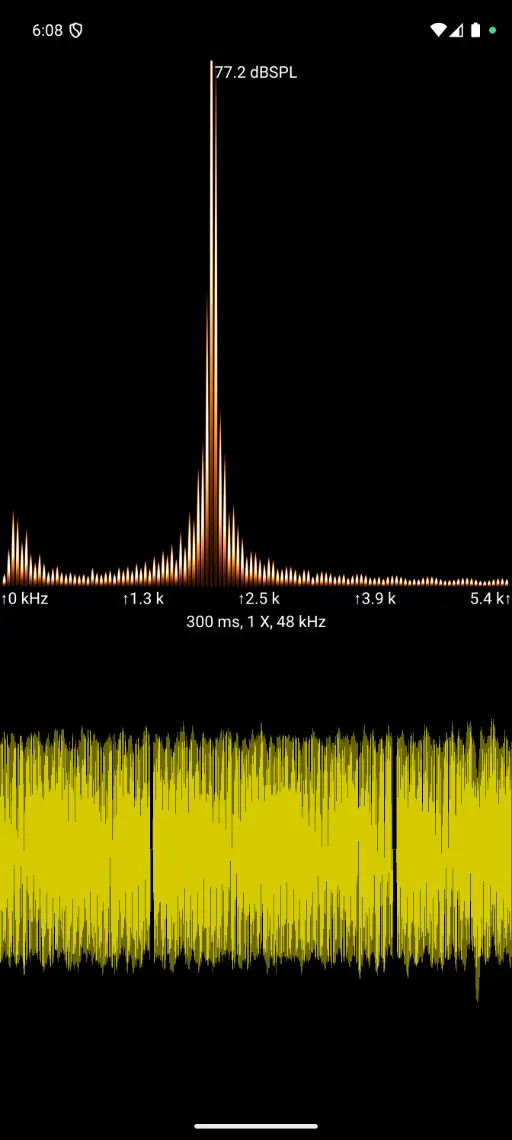
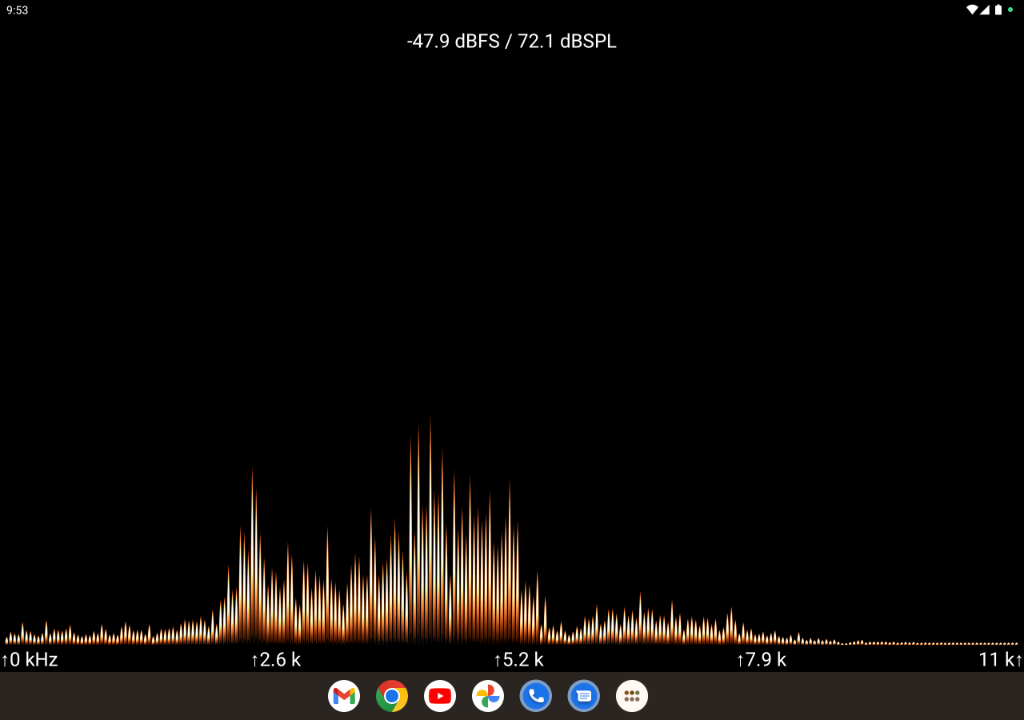
Full Screen Spectrum, Spectral Flames
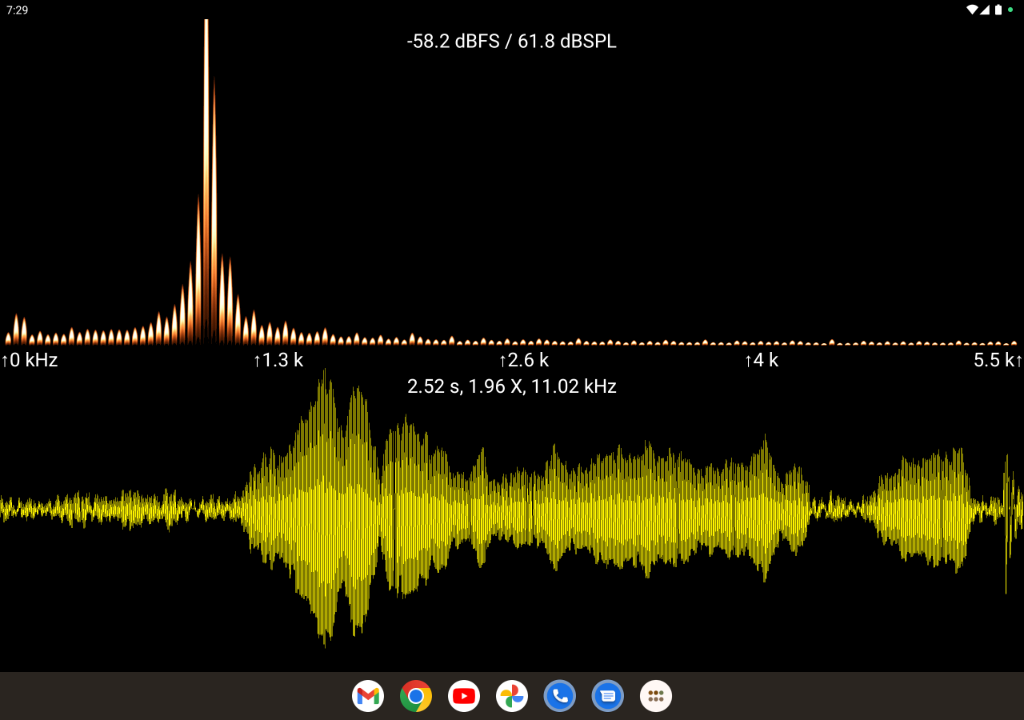
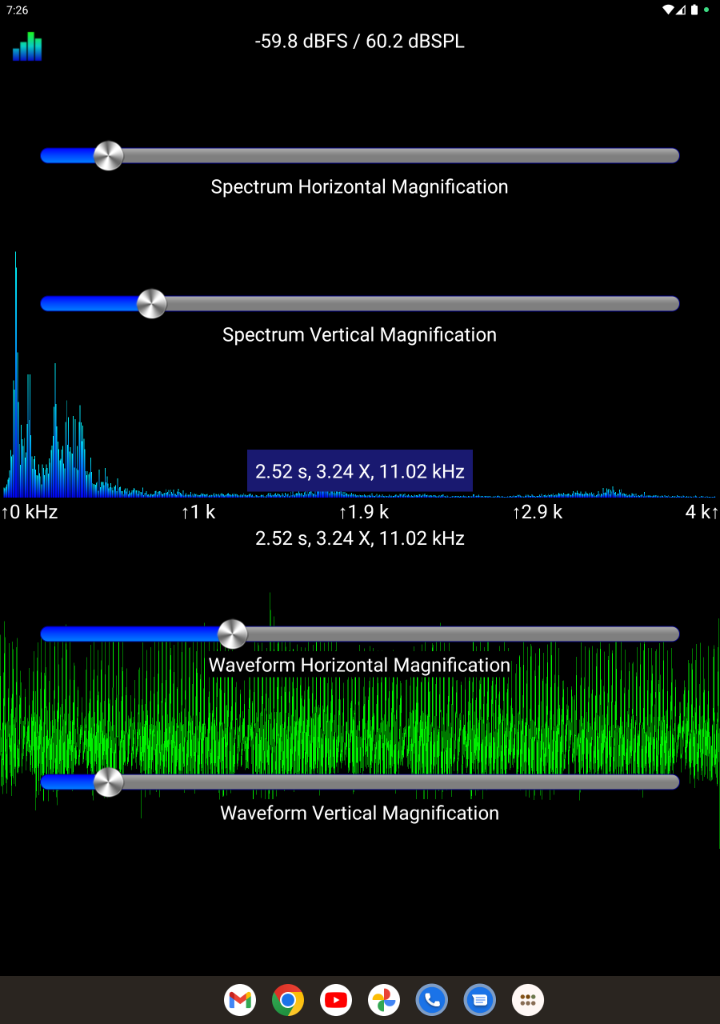
Full Screen, Split View
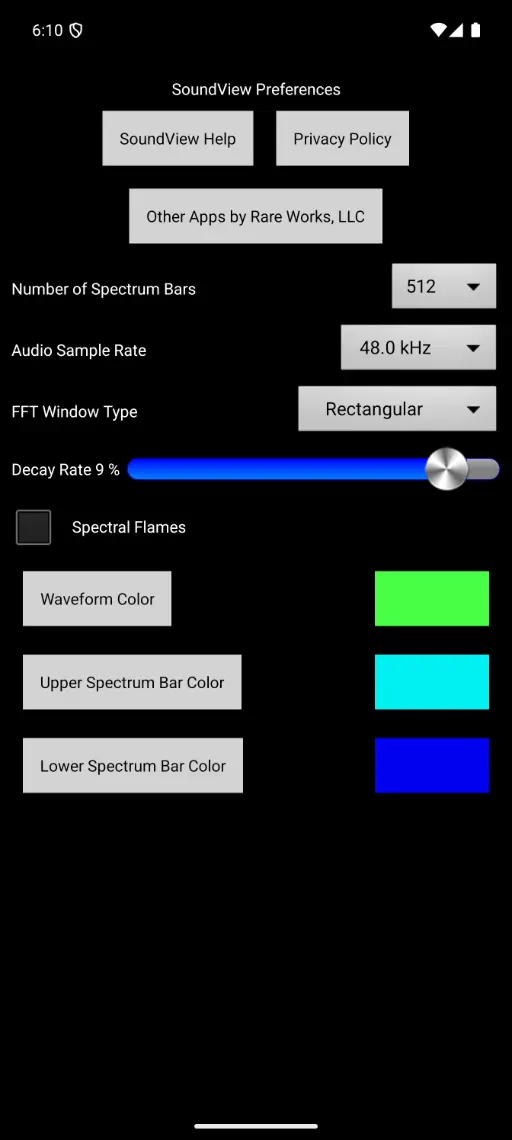
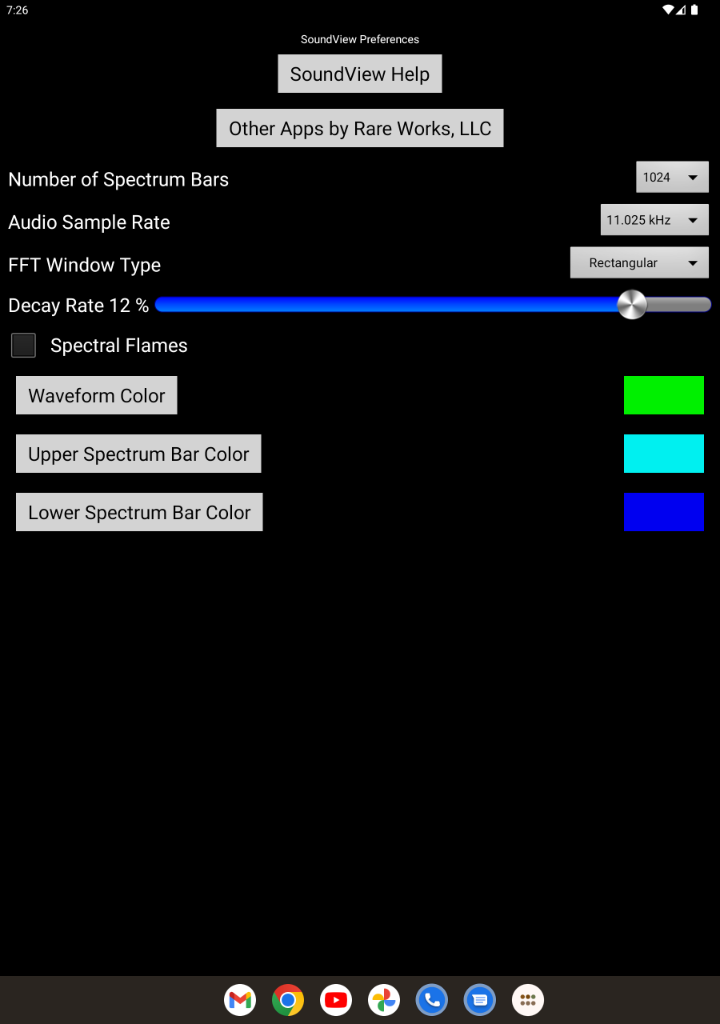
By selecting the settings button, the Settings view appears.
The magnification slider allows you to control height of the spectrum analyzer bars. Depending on the number of bars configured each spectrum bar represents a different number of frequencies, and therefore its value varies with the number of spectrum bars. Ideally the spectrum bar height would indicate the decibel level of that frequency, however each bar represents a range of frequencies, and it's value is a sum of their decibel levels.
The decay rate slider allows you to control how fast the bars fall back to the bottom of the display. The control gives you full control, as the far left will let the value bar fall immediately, and the far right will not allow it to fall at all.
Phone Portrait Views
Tablet Portrait Views
 Spectrum Analyzer Android
Spectrum Analyzer Android
Spectrum Analyzer Android
Spectrum Analyzer Android
Spectrum Analyser Android
Spectrum Analyser Android
Spectrum Analyser Android
Spectrum Analyser Android
Spectrum Analyzer Android
Audio Waveform
Audio Waveform
Decibel Meter
Oscilloscope
Spectrum Analyzer Android
Spectrum Analyzer Android
Spectrum Analyzer Android
Spectrum Analyzer Android
Spectrum Analyzer Android
Spectrum Analyser Android
Spectrum Analyser Android
Spectrum Analyser Android
Spectrum Analyser Android
Spectrum Analyzer Android
Audio Waveform
Audio Waveform
Decibel Meter
Oscilloscope